In this analysis I will be exploring Red Wine dataset.
Code for below analysis is available in Github.
This dataset is public available for research. The details are described in [Cortez et al., 2009]. Please include this citation if you plan to use this database:
P. Cortez, A. Cerdeira, F. Almeida, T. Matos and J. Reis. Modeling wine preferences by data mining from physicochemical properties. In Decision Support Systems, Elsevier, 47(4):547-553. ISSN: 0167-9236.
Available at: [@Elsevier] http://dx.doi.org/10.1016/j.dss.2009.05.016 [Pre-press (pdf)] http://www3.dsi.uminho.pt/pcortez/winequality09.pdf [bib] http://www3.dsi.uminho.pt/pcortez/dss09.bib
-
Title: Wine Quality
-
Sources: Created by: Paulo Cortez (Univ. Minho), Antonio Cerdeira, Fernando Almeida, Telmo Matos and Jose Reis (CVRVV) @ 2009
-
Attribute information:
For more information, read [Cortez et al., 2009].
Input variables (based on physicochemical tests): 1. fixed acidity (tartaric acid - g / dm^3) 2. volatile acidity (acetic acid - g / dm^3) 3. citric acid (g / dm^3) 4. residual sugar (g / dm^3) 5. chlorides (sodium chloride - g / dm^3 6. free sulfur dioxide (mg / dm^3) 7. total sulfur dioxide (mg / dm^3) 8. density (g / cm^3) 9. pH 10. sulphates (potassium sulphate - g / dm3) 11. alcohol (% by volume) Output variable (based on sensory data): 12. quality (score between 0 and 10)
## [1] 1599   12

## 'data.frame':    1599 obs. of  12 variables:
##  $ fixed.acidity       : num  7.4 7.8 7.8 11.2 7.4 7.4 7.9 7.3 7.8 7.5 ...
##  $ volatile.acidity    : num  0.7 0.88 0.76 0.28 0.7 0.66 0.6 0.65 0.58 0.5 ...
##  $ citric.acid         : num  0 0 0.04 0.56 0 0 0.06 0 0.02 0.36 ...
##  $ residual.sugar      : num  1.9 2.6 2.3 1.9 1.9 1.8 1.6 1.2 2 6.1 ...
##  $ chlorides           : num  0.076 0.098 0.092 0.075 0.076 0.075 0.069 0.065 0.073 0.071 ...
##  $ free.sulfur.dioxide : num  11 25 15 17 11 13 15 15 9 17 ...
##  $ total.sulfur.dioxide: num  34 67 54 60 34 40 59 21 18 102 ...
##  $ density             : num  0.998 0.997 0.997 0.998 0.998 ...
##  $ pH                  : num  3.51 3.2 3.26 3.16 3.51 3.51 3.3 3.39 3.36 3.35 ...
##  $ sulphates           : num  0.56 0.68 0.65 0.58 0.56 0.56 0.46 0.47 0.57 0.8 ...
##  $ alcohol             : num  9.4 9.8 9.8 9.8 9.4 9.4 9.4 10 9.5 10.5 ...
##  $ quality             : int  5 5 5 6 5 5 5 7 7 5 ...
Quality will be the main focus of this analysis. I want to know which variables can best affect the quality of wine, and what are their optimal quantities. This dataset consists of 12 variables and 1599 observations/wines, so I hope there is much to be learned.
##  fixed.acidity   volatile.acidity  citric.acid    residual.sugar
##  Min.   : 4.60   Min.   :0.1200   Min.   :0.000   Min.   : 0.900
##  1st Qu.: 7.10   1st Qu.:0.3900   1st Qu.:0.090   1st Qu.: 1.900
##  Median : 7.90   Median :0.5200   Median :0.260   Median : 2.200
##  Mean   : 8.32   Mean   :0.5278   Mean   :0.271   Mean   : 2.539
##  3rd Qu.: 9.20   3rd Qu.:0.6400   3rd Qu.:0.420   3rd Qu.: 2.600
##  Max.   :15.90   Max.   :1.5800   Max.   :1.000   Max.   :15.500
##    chlorides       free.sulfur.dioxide total.sulfur.dioxide
##  Min.   :0.01200   Min.   : 1.00       Min.   :  6.00
##  1st Qu.:0.07000   1st Qu.: 7.00       1st Qu.: 22.00
##  Median :0.07900   Median :14.00       Median : 38.00
##  Mean   :0.08747   Mean   :15.87       Mean   : 46.47
##  3rd Qu.:0.09000   3rd Qu.:21.00       3rd Qu.: 62.00
##  Max.   :0.61100   Max.   :72.00       Max.   :289.00
##     density             pH          sulphates         alcohol
##  Min.   :0.9901   Min.   :2.740   Min.   :0.3300   Min.   : 8.40
##  1st Qu.:0.9956   1st Qu.:3.210   1st Qu.:0.5500   1st Qu.: 9.50
##  Median :0.9968   Median :3.310   Median :0.6200   Median :10.20
##  Mean   :0.9967   Mean   :3.311   Mean   :0.6581   Mean   :10.42
##  3rd Qu.:0.9978   3rd Qu.:3.400   3rd Qu.:0.7300   3rd Qu.:11.10
##  Max.   :1.0037   Max.   :4.010   Max.   :2.0000   Max.   :14.90
##     quality
##  Min.   :3.000
##  1st Qu.:5.000
##  Median :6.000
##  Mean   :5.636
##  3rd Qu.:6.000
##  Max.   :8.000
Univariate Plots Section
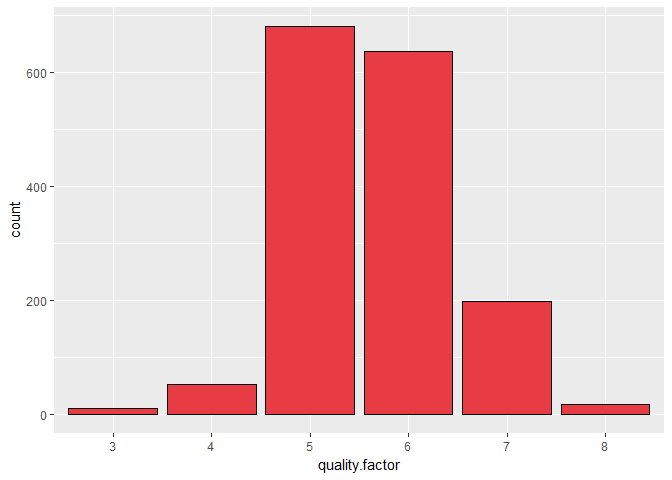
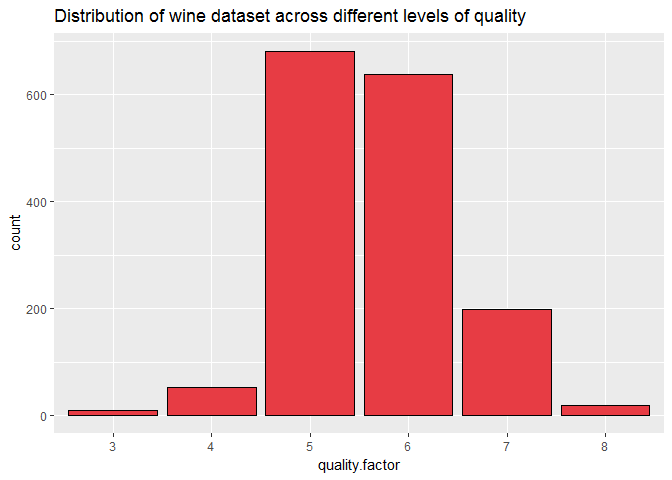
We see that wine quality is approximately normally distributed.
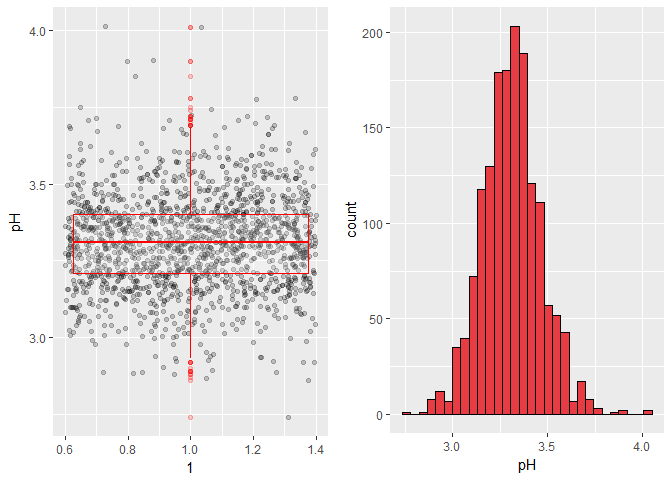
The pH is normally distributed, with few outliers.
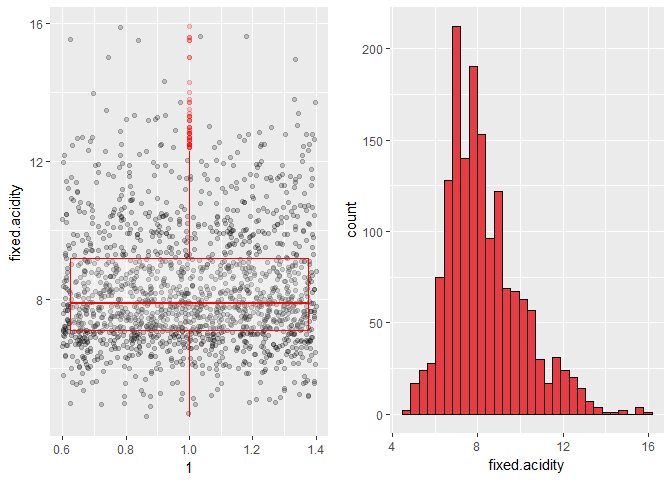
Fixed acidity have some outliers and peaks between 6 and 7 g/dm^3.
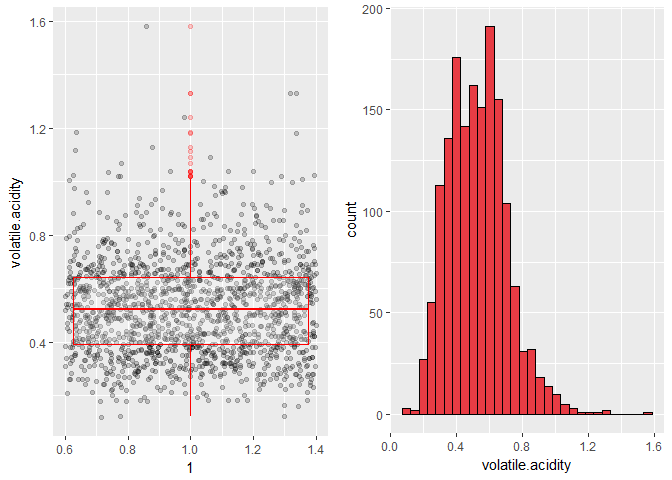
Volatile acidity has quite a few outliers with high values.
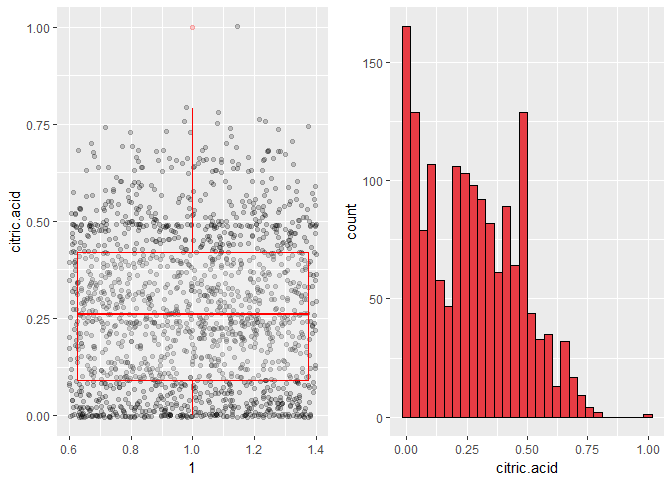
It looks like most of the wines have 0 g/L of citric acid. There are also spikes at 0.02, 0.2, and 0.48.
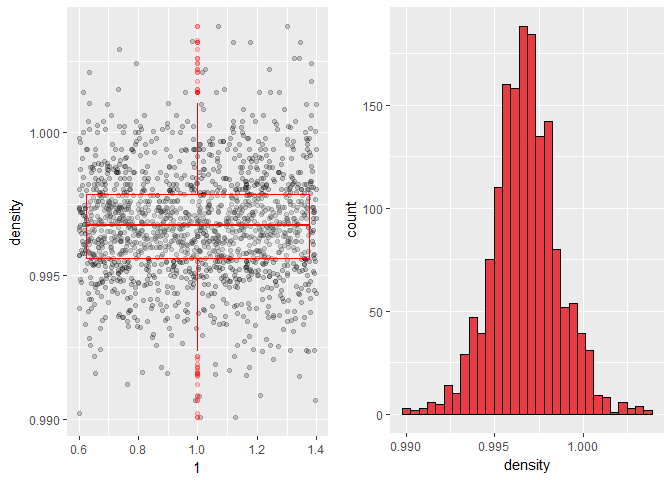
Density has an almost normal distribution with few outliers.
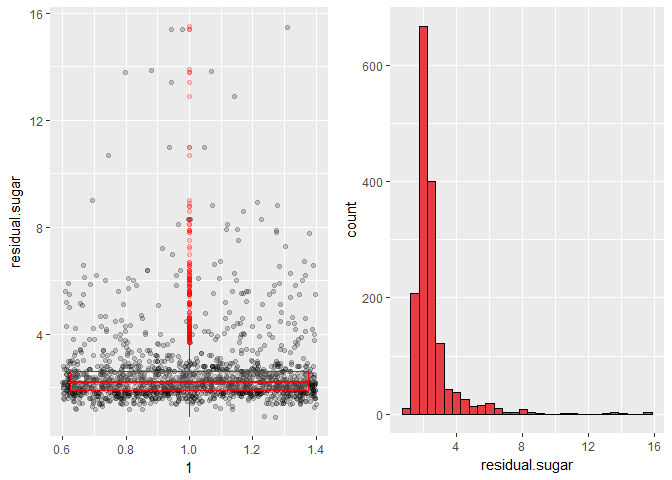
There are many outliers with high residual sugar and the distribution is skewed right.
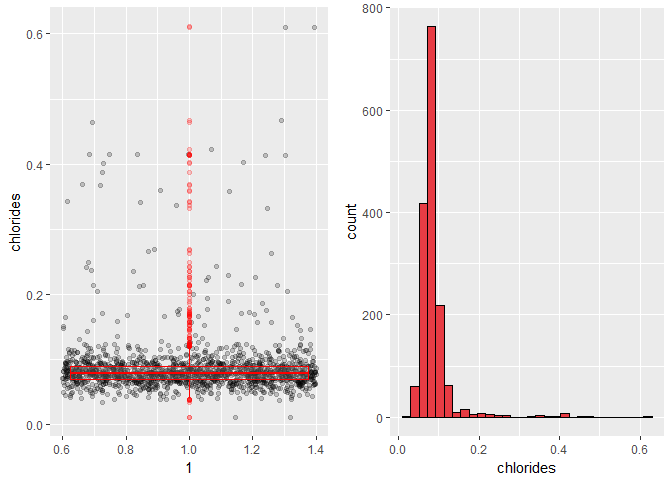
Chloride distribution is skewed right and with outliers. I will use log transformation later on.
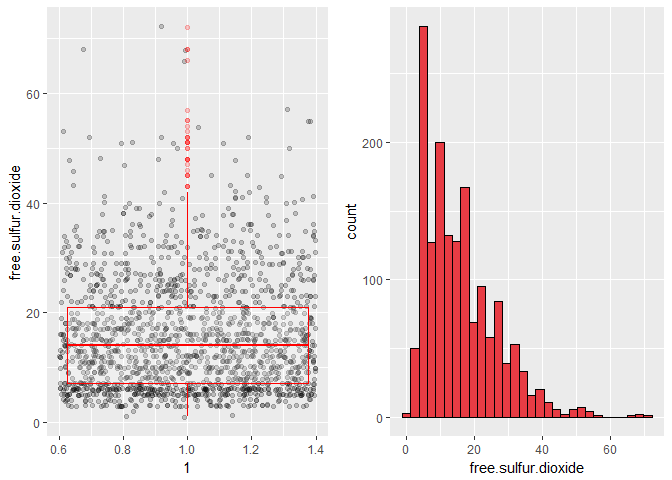
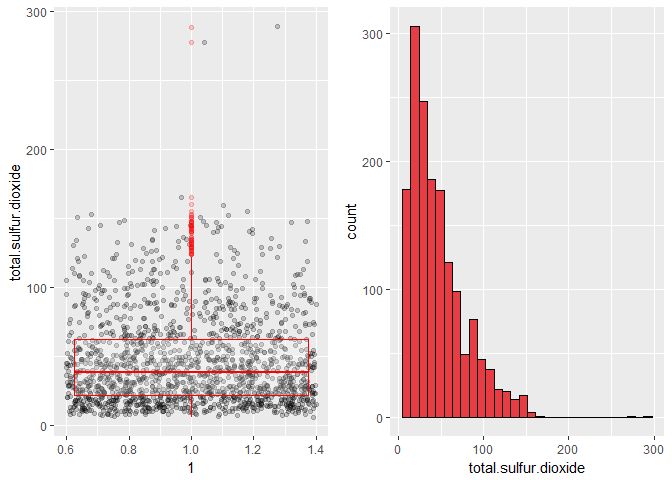
Distribution for free.sulfur.dioxide and total.sulfur.dioxide is skewed right. Log transformation can be applied on free.sulfur.dioxide and total.sulfur.dioxide.
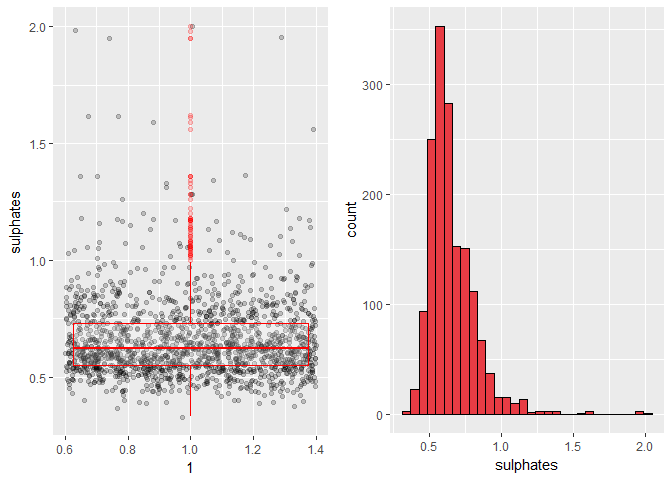
Distribution for sulphates is skewed right with some outliers.
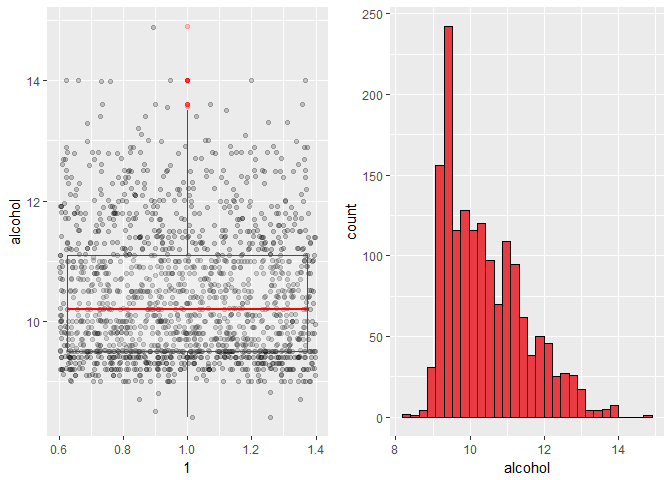
The alcohol distribution is right-skewed. It will be interesting to see whether different quality wines have distinct alcohol content.
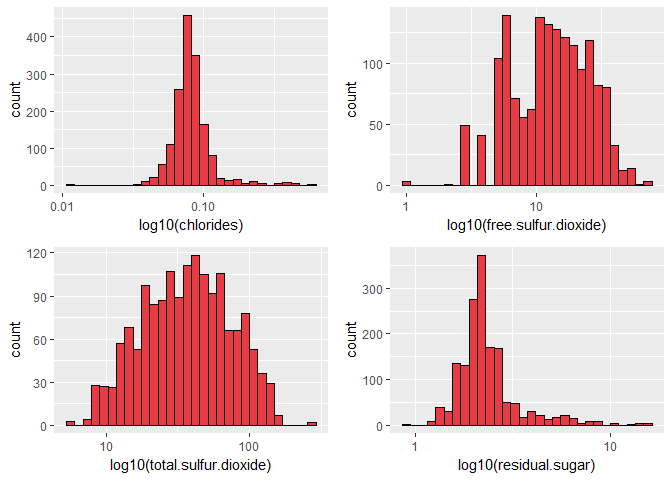
Taking log transformation of chorides, total.sulfur.dioxide, nresidual.sugar, free.sulfur.dioxide makes their distribution normal.
Univariate Analysis
What is the structure of your dataset?
There are 1599 observation and 13 attributes in this data set. Except quality variable which is categorical, the variables are numeric.
Other observations include:
- Most of the wine have quality 5 or 6 on the scale of 0-10.
- Most of the wines have pH between 3.2 and 3.4
- Mean alcohol amount is 10.42% -
- Average sugar amount is 2.54 g/dm^3 with the maximum 15.5, which means all of the wine samples are not sweet.
What is/are the main feature(s) of interest in your dataset?
The main feature of interest is the quality rating. I will investigate how residual.sugar, pH, fixed.acidity, volatile.acidity correlate with the quality of wine.
What other features in the dataset do you think will help support your investigation into your feature(s) of interest?
Density, Chlorides, Alcohol.
Did you create any new variables from existing variables in the dataset?
I will be creating a new variable for ratings depending on the quality if wine.
Of the features you investigated, were there any unusual distributions?
Did you perform any operations on the data to tidy, adjust, or change the form of the data? If so, why did you do this?
The x column was removed as it was simply an index value of unimportance. The loaded data was already tidy, but Sulphates, chlorides, residual sugar and total/free sulphur dioxide all appeared to be long tailed and were log-transformed which revealed a normal distribution for each.
Bivariate Plots Section
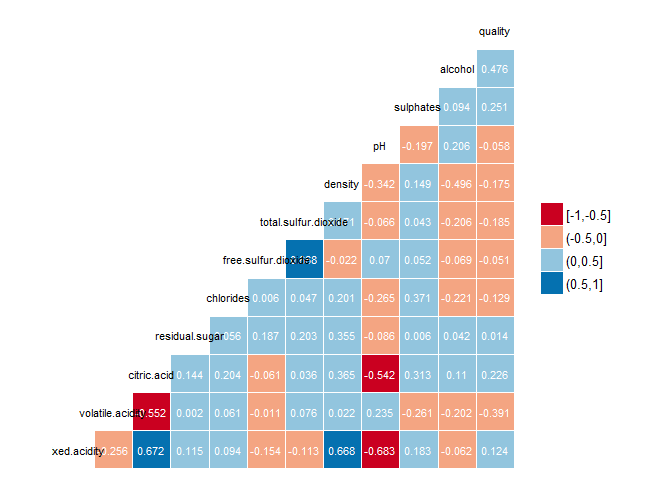
This shows the variables that correlate most highly with quality. These are:
- alcohol (positive correlation)
- sulphates (positive correlation)
- citric.acid (positive correlation)
- volatile.acidity (negative correlation)
- total.sulphur.dioxide (negative correlation)
- density (negative correlation)
I also see that alcohol which is highly correlated with quality, has negative correlation with density.
Let’s investigate how above chemical properties affect quality of wine.
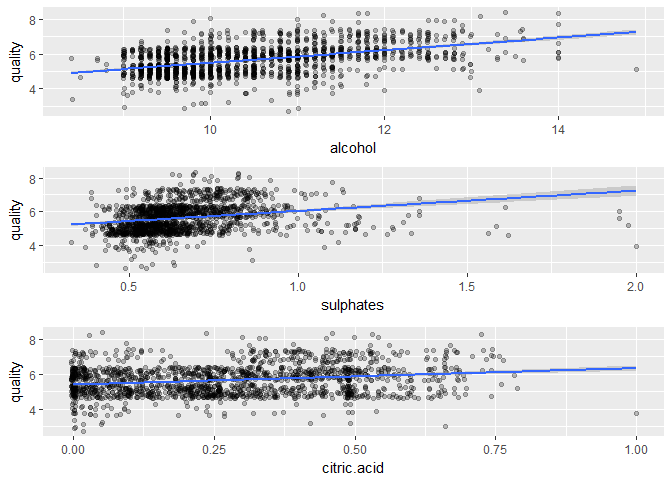
Respective correlation coefficients:
## [1] 0.4761663

## [1] 0.2513971

## [1] 0.2263725
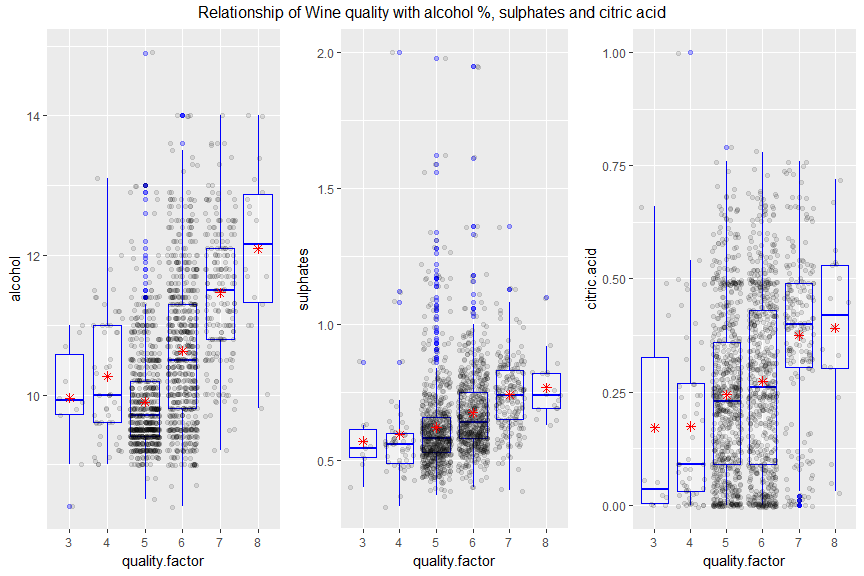
We can definitely see the positive trend for alcohol % and quality of wine. Sulphates and citric.acid also have positive correlation with quality of wine but it needs further investigation.
We see that alcohol, sulphates, and citric.acid are positively correlated to quality of wine, but there are some outliers on the higher end of alcohol and sulphates for the wine of rating 5 for the quality. This says there might be other factors which decide the quality of the wine.
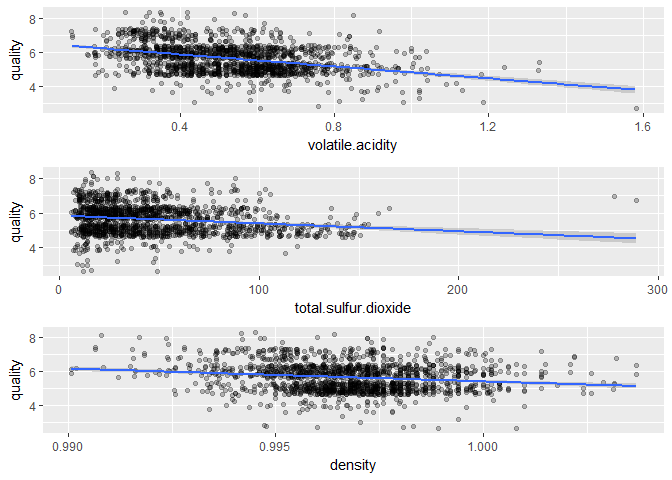
Respective correlation coefficients:
## [1] -0.3905578

## [1] -0.1851003

## [1] -0.1749192
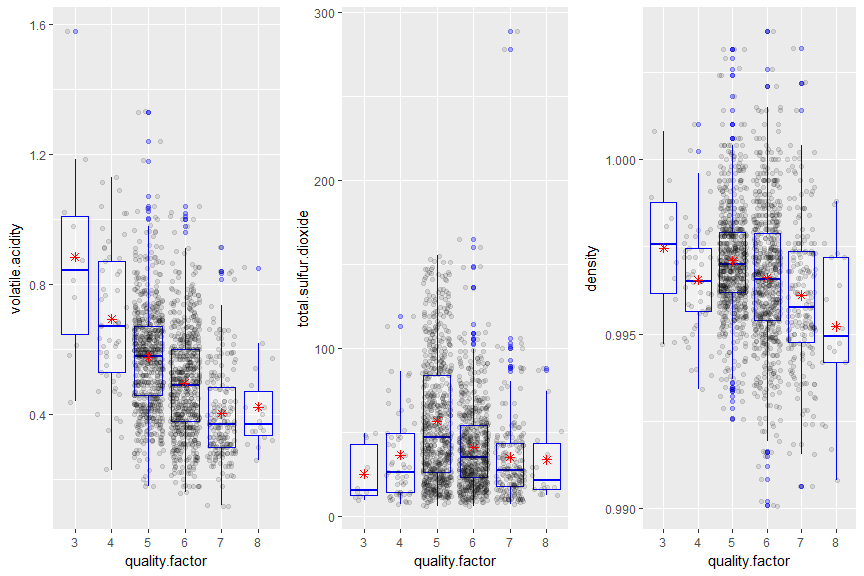
We see that volatile.acidity, total.sulphur.dioxide and density are inversely correlated to quality of the wine but there are some outliers which shows that there are other factors which decide the quality of the wine.
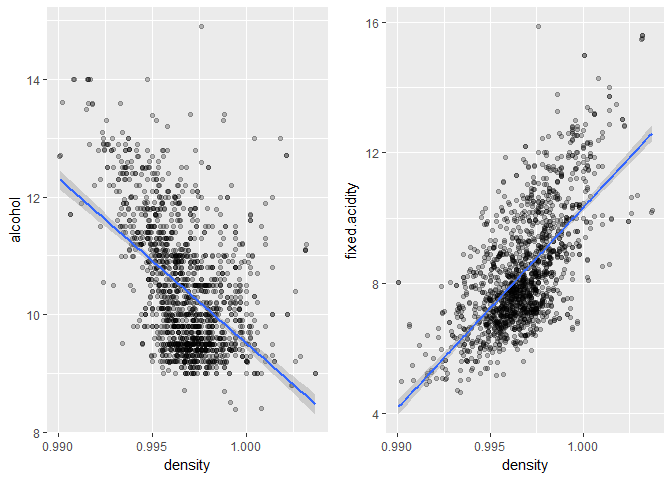
Alcohol and fixed.acidity are positively correlated to quality of wine and from the above plot I see that lower the density, higher the alcohol % and fixed.acidity.
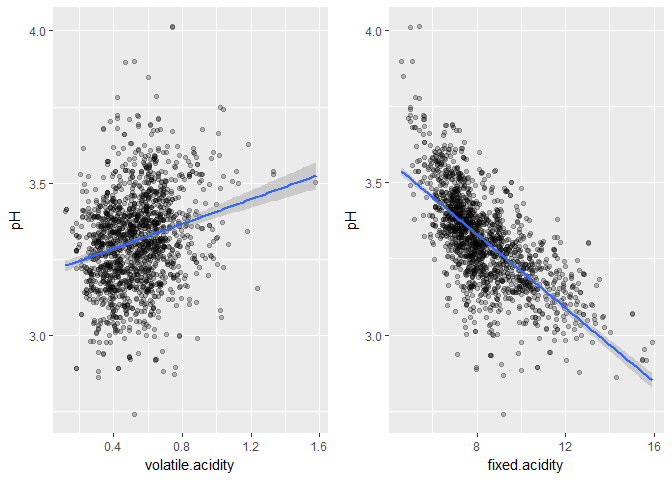
From the above plots we can see that that quality of the wine and volatile.acidity are inversely correlated and volatile.acidity are directly correlated with pH, which shows that wine may be turning into vinegar and it can ruin the wine. On the contrary, fixed.acidity is good for the wine. Most of the acids involved with wine are fixed acids with the notable exception of acetic acid, mostly found in vinegar, which is volatile and can contribute to the wine fault also known as volatile acidity.
Bivariate Analysis
Talk about some of the relationships you observed in this part of the investigation. How did the feature(s) of interest vary with other features in the dataset?
I observed that alcohol, sulphates, and citric.acid are positively correlated to quality of wine and volatile.acidity, total.sulphur.dioxide and density are inversely correlated to quality of the wine.
Did you observe any interesting relationships between the other features (not the main feature(s) of interest)?
I noticed that density and alcohol had a stronger negative correlation than others and I saw that lower the density, higher the alcohol %.
What was the strongest relationship you found?
The strongest relationship I found was between density and fixed acidity with r = 0.67. For the wine quality, alcohol level was the chemical property with the highest correlation with r = 0.47.
Multivariate Plots Section
Levels of Wine quality:
##   3   4   5   6   7   8
##  10  53 681 638 199  18
As we can see that there are 6 levels on quality in our dataset, I will create an new variable called ‘ratings’ with levels ‘good’ for quality 7 and 8, ‘average’ for quality of 5 and 6 and ‘bad’ for quality of 3 and 4.
##     bad average    good
##      63    1319     217
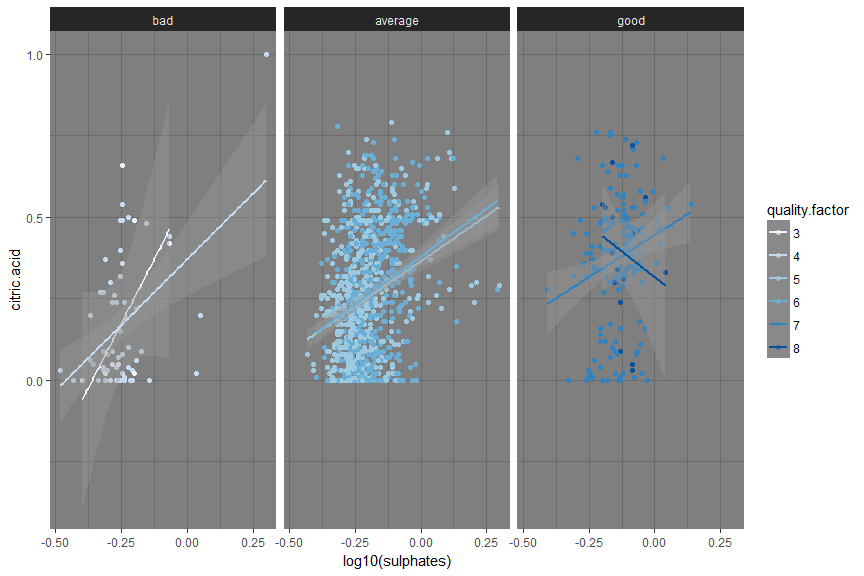
I see that lower quantity of citric acid results in bad quality of wine but there should be very fine balance which makes wine of good or average quality.
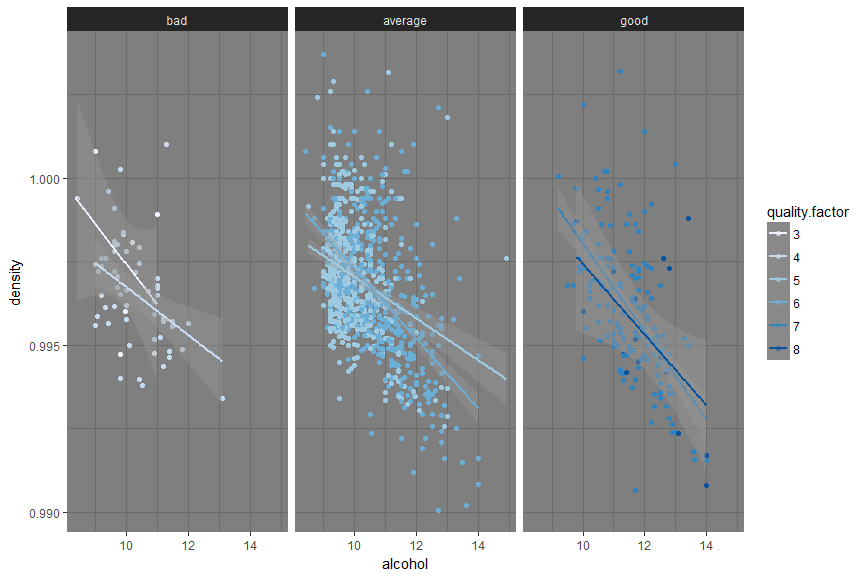
I see the similar pattern but in inverse. There should be fine balance of density and alcohol which makes wine good from an average quality.
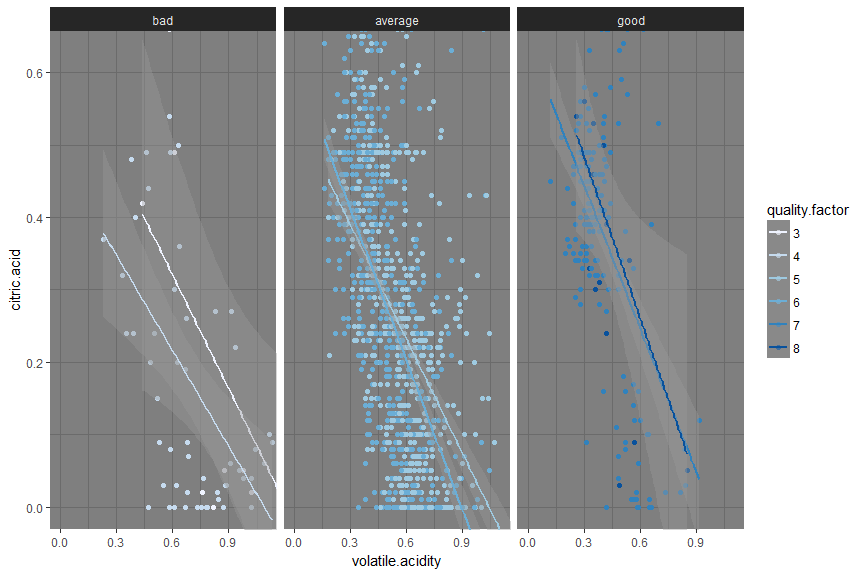
## redwine$rating: bad
##    Min. 1st Qu.  Median    Mean 3rd Qu.    Max.
##  0.2300  0.5650  0.6800  0.7242  0.8825  1.5800
## --------------------------------------------------------
## redwine$rating: average
##    Min. 1st Qu.  Median    Mean 3rd Qu.    Max.
##  0.1600  0.4100  0.5400  0.5386  0.6400  1.3300
## --------------------------------------------------------
## redwine$rating: good
##    Min. 1st Qu.  Median    Mean 3rd Qu.    Max.
##  0.1200  0.3000  0.3700  0.4055  0.4900  0.9150
As mentioned above, the median volatile acidity was 0.68 for bad wines, 0.54 for average wines, and 0.37 for excellent wines. For the upper right cluster under bad wines, we see that the higher alcoholic content of the wines cannot offset the high volatile acidity – that being greater than 0.8 g / dm^3.
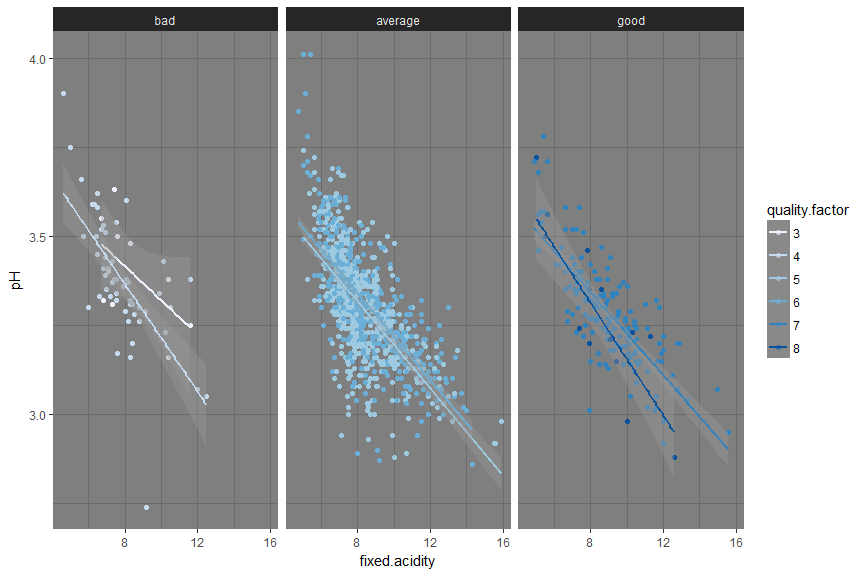
And I can see that lower the pH, higher the acidity.
Multivariate Analysis
Talk about some of the relationships you observed in this part of the investigation. Were there features that strengthened each other in terms of looking at your feature(s) of interest?
I observed that higher quantity of sulphates and citric.acid makes a good wine but with lower volatile acidity of course. Lower density and higher alcohol content makes a good wine.
Were there any interesting or surprising interactions between features?
A well balanced combination of pH and fixed.acidity makes good wine.
Final Plots and Summary
Plot One
Description One
Most of the wines in this dataset are of average quality i.e. 5 and 6.
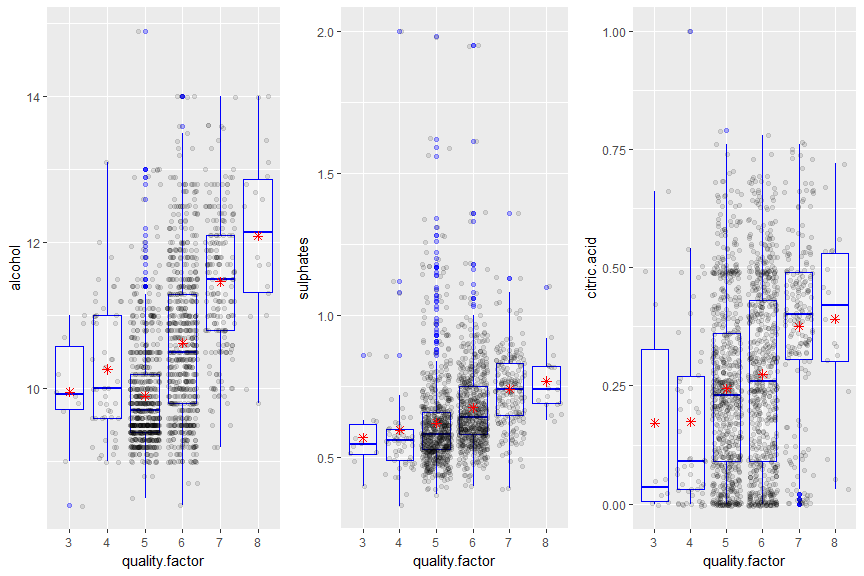
Plot Two
Description Two
From the above plot I can confirm that Quality of the Red wine is directly proportional to Alcohol %, sulphates and citric acid. Since most of the wines were of average quality, we see that there are some outliers for quality of 5 and 6, which says that there are other contributing factors which makes wine good from average quality.
Plot Three
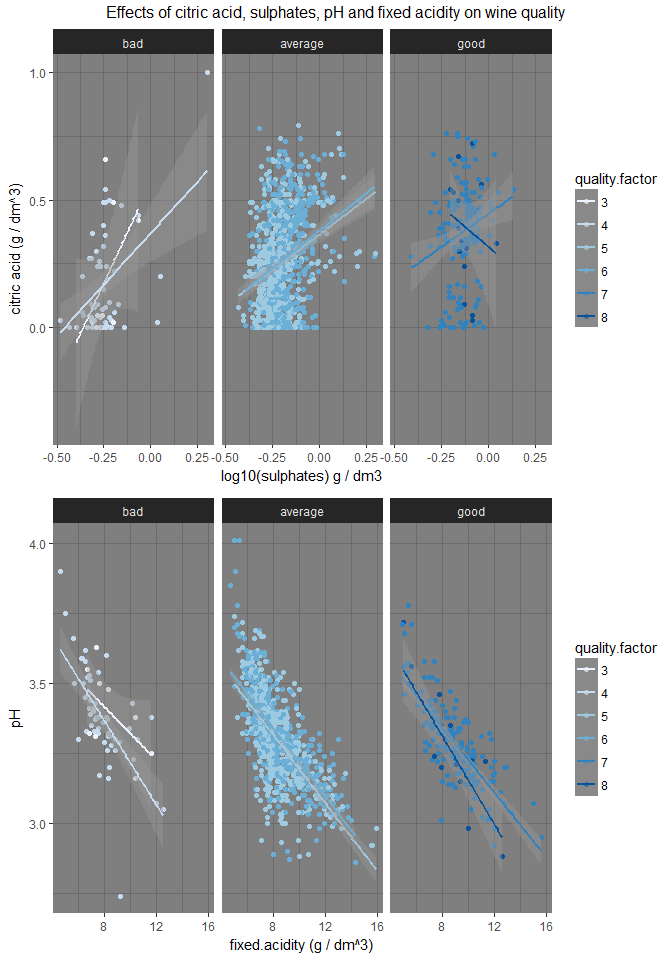
Description Three
In the above I see that citric acid and sulphates have positive effect on the quality of the Red wine and it shows how the right combination of two variables can produce a higher quality wine. Whereas higher pH can make wine bad, here it is important to remember that the lower pH values mean more acidic, although one would probably guess that the more fixed acidity there is, the more acidic the wine is. Acids are major wine constituents and contribute greatly to its taste. In fact, acids impart the sourness or tartness that is a fundamental feature in wine taste
Reflection
The red wine data set contains information on 1599 Portuguese Red Wines. To understand what chemical properites affect their quality, I started by exploring the relationship individual variables with quality and seeing which ones correlated most highly with the quality rating. Based on these findings, I explored the data further, concentrating on the effect of alcohol, volatile acidity, sulphates content and citric acid. My findings showed that most good red wines have a high alcohol, sulphate and citric acid levels and low volatile acidity.
Using a combination of box and scatter plots in the bivariate analysis, it could be rather clear as to what amounts of each variable produces the best quality of wine. When correlation and summary charts are added to the analysis, our understanding of the data became even stronger.
Limitation of the current analysis is that the current data consists of samples collected from a specific portugal region. It will be intresting to obtain datasets across various wine making regions to eliminate any bias created by any specific qualities of the product. There might be other factors such as region and climate which may also have effect on wine quality.
Further work could be carried out to build a linear model to predict the quality of red wine.